After a few minutes of tinkering with ORBIS: The Stanford Geospatial Network Model of the Roman World, one of my students exclaimed, “It’s like Google Maps, but for Rome!” She wasn’t the first to make that connection. Four years ago Curt Hopkins noticed the similarity in an article for Ars Technica. At first glance it makes a lot of sense. Like Google Maps, ORBIS plots a route between two points. The ORBIS model allows users to choose between 632 sites in the Roman Empire (circa 200 CE) and simulate a journey between the sites, complete with information concerning the duration, distance traveled, and cost of the journey based on the tetrarchic price edict of 301 CE. Users can also specify the month the trip takes place, control the mode of transportation, and prioritize speed, length, or price. In addition to calculating routes between two sites, the model also allows users to create network diagrams that estimate the distance, cost, and time between one site and the others in the model. Finally, users can also create cartograms and flow diagrams that further reveal the connections between various parts of the network.
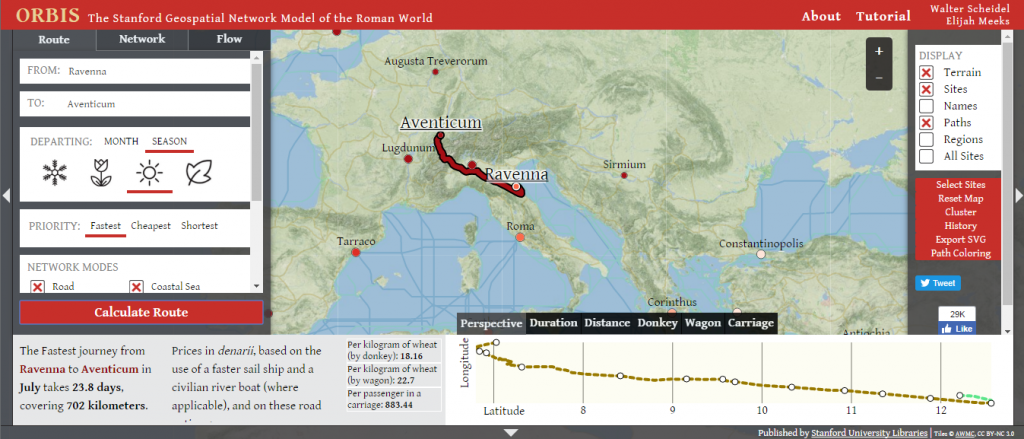
Figure 1: Ravenna to Aventicum with the details in the lower left corner
A digital humanities grant from Stanford University funded the creation of ORBIS in 2012. Walter Scheidel, Dickason Professor in the Humanities at Stanford University, took the lead with technical help from Elijah Meeks, Karl Gossner, and Noemi Alvarez. Designed with both the public and academy in mind, ORBIS has reached more than 750,000 users from over 200 countries. In a detailed tutorial that accompanies the project, the authors clearly outline their data sources and the model’s limitations. The developers drew from a wide range of sources and took into account factors such as average wave height and wind speed for sea travel, weather’s effect on road closures, and current speed. A review by Stuart Dunn in the Journal of Digital Humanities provides a more detailed analysis of the project’s scholarship, usability, and limitations.
ORBIS is one of the many digital projects on the classical Roman world, including the Digital Atlas of Roman and Medieval Civilizations, the Perseus Digital Library, and Epigraph Database Roma. In addition, the Department of Digital Humanities at King’s College London and the Stoa Consortium at the University of Kentucky host “The Digital Classicist,” a well-maintained list of relevant digital projects. ORBIS pairs well with many of these projects.
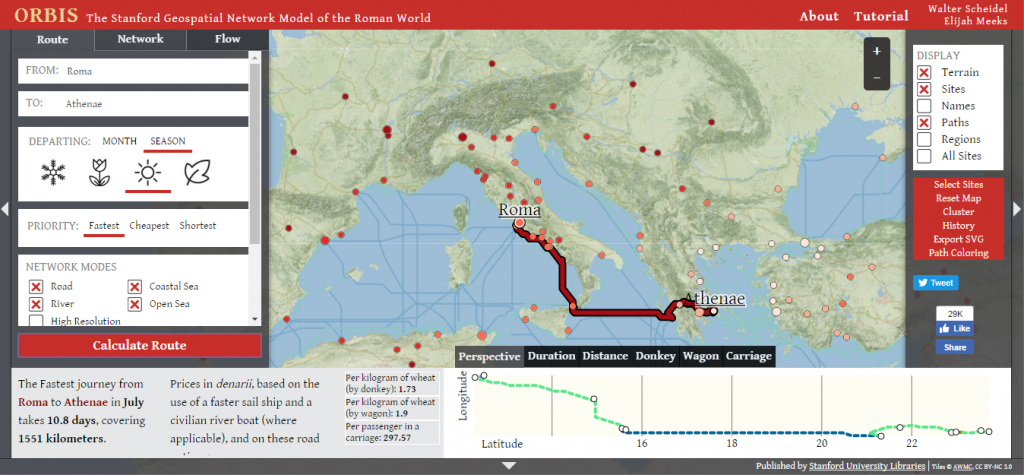
Figure 2: Ravenna to Athens with the details in the lower left corner
As a teaching tool, ORBIS offers an easy entry into digital history projects. Many students and instructors are familiar with similar interfaces via Internet mapping programs like Mapquest and Google Maps. Before unleashing the students on the program, I use it to facilitate a whole group discussion and sometimes pair it with a brief in-class writing assignment. Modeling is important because even though most students will intuitively understand the basics of ORBIS, I usually encounter a few per session who need some guidance. In addition, I use modeling to highlight some of the most powerful aspects of the program by selecting a few specific routes. For example, I often emphasize the difference in travel over land and over sea. The 702 kilometer overland trip from Ravenna to Aventicum (fig. 1) is simulated to take 23 days, while the simulated trip from Ravenna to Athens (fig. 2) of 1542 kilometers takes less than half the time and is half as expensive.
I ask the students to explain the reasons for the difference, guiding them to an understanding of the difference between travel by foot and by sail. As we explore the ways that sea travel is both faster and cheaper, the students begin to understand why a commercial empire would be built around water. This leads to a broader discussion on how environments shape trade and empire building. We then compare trade in the Mediterranean with other water-based trading routes in the Indian Ocean and contrast it with land-based trade in Asia along the Silk Roads and the Sand Roads crossing the Sahara in northern Africa. Finally, I ask them to think about the “tyranny of distance” and how various transportation and communication technologies shape their understanding of the world around them. Just as better maritime technologies might have made Athens seem closer to Ravenna than Aventicum, the same might be said of communication technologies like video chat and transportation technologies like the airplane. If time permits, we move beyond the basic routes to look at the program’s cartograms, network flows, and maps to further our discussion of the role of geography.
After modeling ORBIS and discussing what the program tells us about the Roman world, I give students the opportunity to chart their own paths. As they use ORBIS, I push them to interrogate the program’s approach to its data. Where does ORBIS get its information? How does it calculate the length, duration, and cost of each trip? I ask each student to independently calculate the same route, and compare their results. Why is every day’s journey the same duration? Does that fit their experiences with their daily commutes to school? In my experience these questions have yielded fruitful discussions and in-class writing assignments.
Asking these questions with ORBIS is valuable because the program provides detailed answers. While ORBIS uses a wide range of information from a host of sources, it is forced to make a series of assumptions and design choices. These are laid out in detail in the “Building” subsection under the program’s “About” tab. Further information can be found under the “Research” and “Understanding” subsections. Discussing ORBIS’s rationale, and comparing its explanations with that of other digital projects, encourages students to think critically about how the digital tools they use are always making choices, even when those choices are left unidentified and unexplained. Of course, teaching students to critically examine the choices made by the media they consume goes far beyond the projects they use in their history courses—it pushes them to be more reflective about the news they consume, the apps they use, and much more. Asking students to reflect on the importance and consequence of design choices broadens their understanding of ways to interpret and make sense of their past and present.
Below I have included two sample assignments that can be adapted for students from elementary school to higher education. The first asks students to use ORBIS to craft a hypothetical journey. The second assignment is an essay on ORBIS and the Digital Atlas of Roman and Medieval Civilizations. These assignments can be scaled up or down in complexity to fit the needs of your students and classroom. I have even used ORBIS in classes and workshops on research methods, the history of the United States, migration and ethnicity, and education methods as an entry point into digital history. I encourage you to share your use of the program in the comments, on Twitter (@johnrosinbum) or via e-mail (john.rosinbum@gmail.com). Next month we’ll examine some of the impressive series of projects examining what W. E. B. Du Bois called “(t)he most magnificent drama in the last thousand years of human history,” the Transatlantic Slave Trade.
Sample Assignment: Charting Your Journey with ORBIS
Sample Assignment: Comparing Spatial Depictions of the Roman World
This post first appeared on AHA Today.
Tags: AHA Today Digital History Environmental History Teaching Resources and Strategies Teaching with Digital History
Comment
Please read our commenting and letters policy before submitting.


