Introduction
Over the course of the summer, our team of eight undergraduate researchers collected data and engaged in historical research on tuberculosis, or consumption as it was known historically, in the United States. In the first post on our research, “Who Died of Consumption?” we discussed our research process and delved into the connections between race, newspaper reporting, and experiences with the disease as exemplified by tuberculosis victim and famous African American poet Paul Dunbar. In this post, we will talk about the results of our research, the implications of our project, and our plan to disseminate the information we have collected to raise awareness about how tuberculosis shaped the lives of its victims.
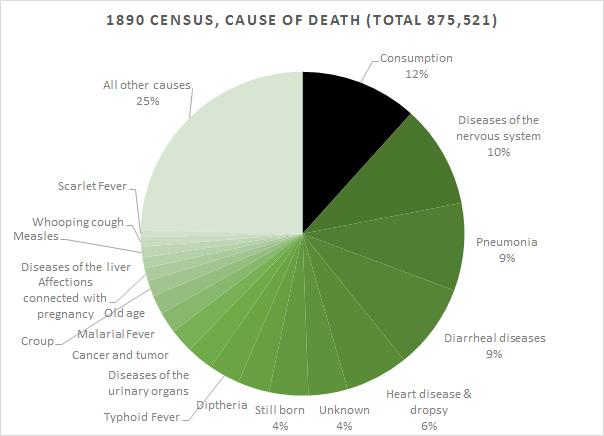
Figure 1. Proportional Cause of Death, from 1890 United States Census. Source: Report on Vital and Social Statistics of the United States, Eleventh Census, 1890, Part I. Analysis and Rate Tables, Table 1, p. 514–15.
According to census data from 1907, tuberculosis caused 11.2 percent of US deaths, making it the single highest cause of death in the country at the time (fig. 1). Through the period of 1870 to 1910, which was the focus of our project, it is estimated that the disease killed three to four million Americans, claiming over 100,000 victims a year at its peak. In the 12 weeks we worked on this project, we documented close to 6,500 victims by working with 37 mainstream newspaper titles, 16 major African American newspapers, and 9 Native American newspapers. While there has been substantial work done in the history of tuberculosis, our project is unique in its creation of a data set that includes a wide sample of Americans who lived with and died from this disease.
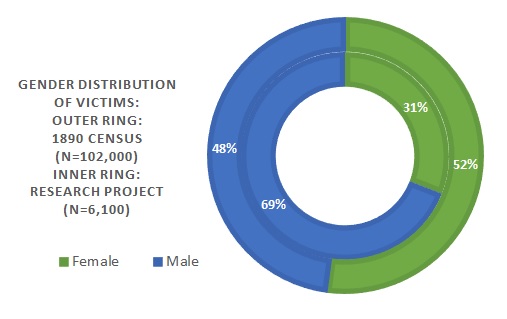
Comparison between census data and newspaper data on gender of tuberculosis victims. The outer circle shows data from the 1890 US Census, which indicates that men and women were equally affected by the disease. The inner circle shows data we collected from newspapers for the same time period, which shows that obituaries for male victims appear more than twice as frequently as obituaries for female victims.
Results
We parsed our data using several methods of analysis. For example, we used census data to analyze information on gender and occupation. Of the obituaries where gender could be determined, 69.5 percent of the victims were male and 30.5 percent were female. We compared these proportions to the 1890 US Census data, which recorded that deaths by consumption across gender were about equal. Though the disease affected men and women at similar rates, newspaper reporting featured male victims over twice as often as female victims (fig. 2). This trend speaks to larger issues of gender discrimination within society during this historical period.
We conducted a similar analysis of occupation, a category of information that could be found for approximately one-third of our victims. From our preliminary analysis of the data, we found that a majority of victims whose occupation was listed worked as accountants, bookkeepers, clerks, retail workers, printers, and lawyers. A very small percentage of victims were reported to be servants, stone cutters, or in other laboring professions. Census data from this period, in contrast, reported that lawyers and physicians were the least likely to die from consumption, while servants and stone cutters made up higher proportions of victims. It appears that the newspapers we surveyed tended to over-report individuals with what we would now refer to as white-collar jobs, in contrast to those engaged in service or manual labor. Thus, the experiences of working-class victims, who were more susceptible to die from the disease, were not publicized as frequently as middle- or upper-class victims.
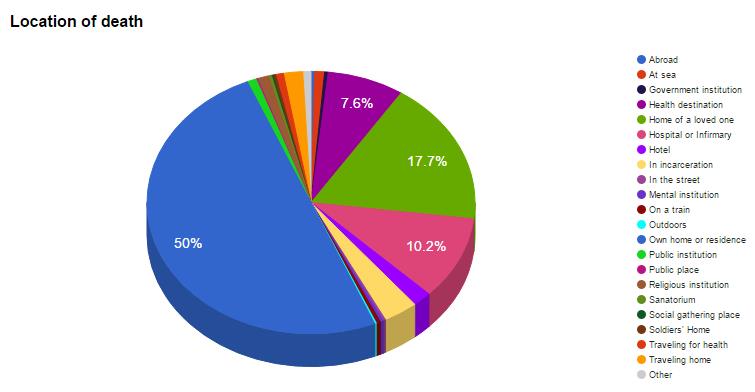
Figure 3. Chart showing specific location of death, when given. The victim’s own home or residence was the most common location of death, followed by the home of a loved one (another personal setting).
Another method of analyzing our data was tracking change across time. This method is best exemplified in our analysis of death location. More specifically, we were interested in how newspapers described where victims of tuberculosis died (fig. 3). We found that from 1870 to 1910, newspaper obituaries became increasingly more specific about the location of death. Additionally, we found that across the span of 40 years there was a steady rise in the percentage of people dying at home, or at the home of a loved one. By dividing our data by decade, we were able to make inferences about larger cultural and medical trends.
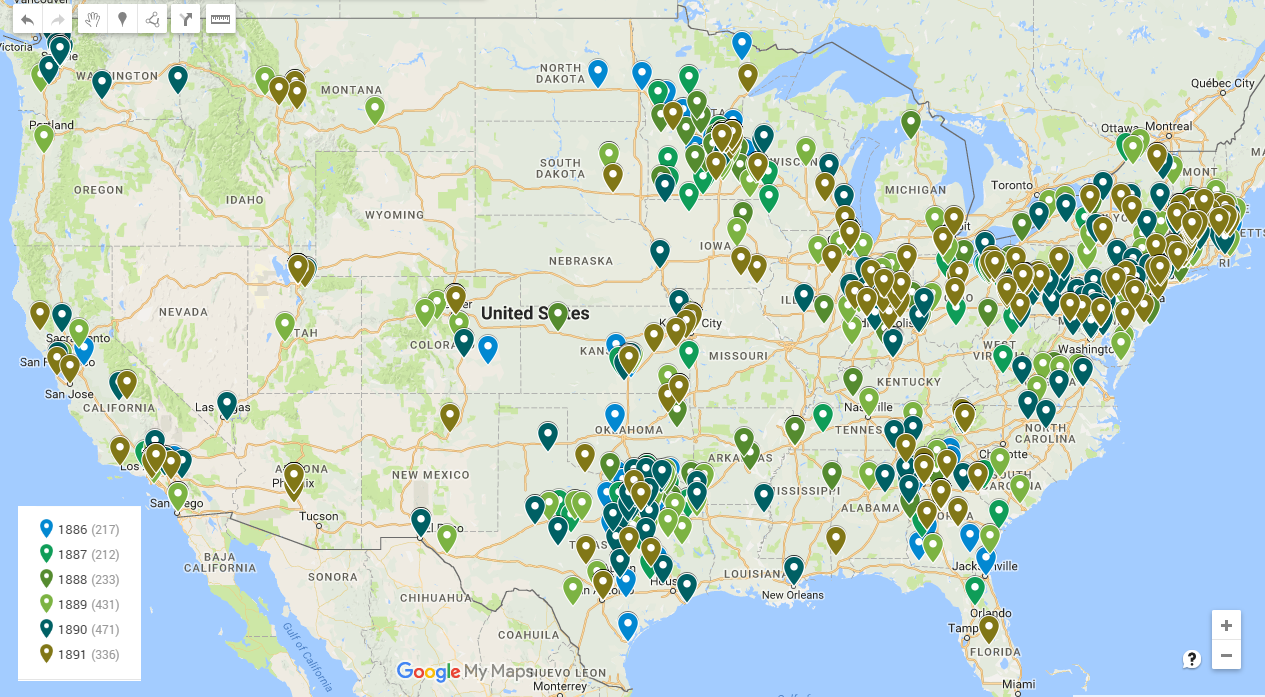
Figure 4. Map of Consumption Victims, 1886 to 1891 (approximately 2,000 victims)
After parsing our data, we conducted research to situate our findings within a larger historical context. To explain why newspapers became increasingly more specific over time about the death location of victims, we researched the cultural and medical context of death and of consumption in historical medical journals, articles about the disease, and scholarly work on the history of medicine and tuberculosis. Because location of death often spoke to the quality of the death, and also because germ theory was becoming more widely accepted during this period, newspapers may have wished to provide information surrounding the circumstances of a victim’s passing and to address concerns about containment. Historical research also suggested a number of potential reasons for why the home became an increasingly more common location of death within our data set: cultural preferences and stigmas, the costs of institutional care and the shortage of facilities, theories of best treatment centered around open air that were more conducive in a personal setting, the rise of a consumer culture based on home care products and services, and prejudicial hospital practices and policies that limited or discouraged people from seeking relief there. Further research on individual victims might provide insights about which of these causes mattered for which populations and whether these patterns changed in the ways that our preliminary analysis suggests.
The Future of Our Project
Moving forward, our goal is to make our data set available to a wider audience. In order to do this, we plan to create a database that allows the public, including students, to access this data. Figure 4 is a map available from the project website that shows the location for nearly 2,000 victims who died in just a five year period, from 1886 to 1891. Researchers can click on any of the markers to see more information about individuals, including name, date of death, and newspaper title. We hope that researchers would be able to use this database to raise awareness about tuberculosis as a continuous health threat, learn more about newspaper reporting in historical contexts, and inspire further research about the victims of consumption.
This post first appeared on AHA Today.
Courtney Howell is a recent graduate of Virginia Tech with bachelor’s degrees in history, political science, and Russian as well as an additional major in philosophy.
Tori Irvine is a senior at the University of Virginia, pursuing a bachelor’s degree in history, with plans to head to grad school for public policy in the next few years.
Ian Criman is a senior at George Mason University, pursuing a bachelor’s degree in communication and plans to pursue a master’s degree in either mass communication or interpersonal communication when he graduates in May.
Luis Villavicencio is a senior at Virginia Tech, majoring in computer science and design with an interest in entrepreneurship.
Tags: AHA Today Resources for Undergraduates Digital History African American History History of STEM
Comment
Please read our commenting and letters policy before submitting.


