The most common way we interact with maps today is through apps and platforms like Google Maps. However, it is easy to forget that like anyone creating a document, map creators make practical and aesthetic decisions about what maps do and how they look. Helping students become critical consumers of maps and media was a crucial component of a class I taught on the history of San Francisco.
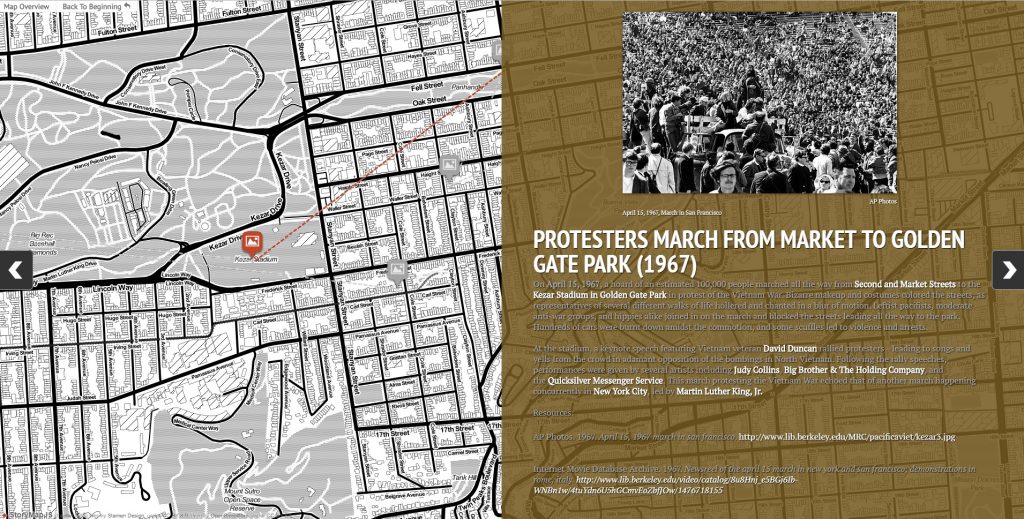
A screenshot from a student example of a StoryMapJS assignment. Credit Gabe Tauro
San Francisco’s unique layout, its distinct neighborhoods, and the vast scholarly attention to the city’s historical geography provided a perfect focus for studying spatial history. I conceived of this course as a way for students to learn the city’s history while developing digital literacy. Students designed and implemented digital projects that communicated historical content using digital tools. Scaffolding skills to build up to the final projects, students shared and analyzed primary sources via Twitter, blogged as a means of crafting historical analysis for a public audience, and used digital mapping tools throughout the semester.
While incorporating mapping and spatial history into a course on San Francisco was a natural fit, instructors can integrate mapping broadly into history courses on any topic, and students can learn mapping as a self-contained skill in one or two class periods. Engaging in the process of mapping enables students to think critically about the relationships between the different spaces they are studying. Students, for example, could read an excerpt of an Oregon Trail diary and map the points mentioned throughout the source. In the process, students would learn valuable spatial and digital skills, while also discovering that as travelers moved from East to West, the places they traveled became less concrete and more difficult to map (for example, locating a city, river fork, or a fort is far easier than plotting where “the sapling grove” might be). Mapping locations enables students to dig into primary sources and consider spatial relationships in new and productive ways.
To help students analyze and create maps, and to understand the practical and aesthetic choices made by map designers, I started my introduction to mapping in this course with an activity based on Lincoln Mullen’s Map Literacy exercise. I structured the class discussion around two categories of maps—narrative maps and data maps. Narrative maps, as Mullen describes, “tell a story plotted through space.” These maps tend to include descriptive text, images, and multimedia components rather than copious data. StoryMapJS and ArcGIS’s StoryMaps are two accessible tools students can use to create narrative maps.
In contrast, data maps integrate geographic data and spatial features to show trends and patterns. Students examined several data maps, including those in Andrew Robichaud and Erik Steiner’s Trails of Blood and Cameron Blevins’ Geography of the Post to consider the possibilities of data mapping and the choices made by the creators of these maps. Then, using a Gathering Data Tutorial during one 75-minute class period, students practiced creating datasets to use in later mapping activities. During the tutorial, students used historic San Francisco phone books to create customized datasets to familiarize them with the .csv (comma separated values) format. Students then paired locations with geodata (in this case, GPS coordinates with addresses from phonebooks). While teachers could skip this step by creating datasets for students or finding datasets online to distribute, teaching students to generate their own datasets has several benefits. First, publicly available history datasets are rare, vastly limiting the topics historical mapping projects could connect to in the classroom. Furthermore, learning this skill empowers students to explore topics of interest and to complete original historical research. While their datasets may start small, students can combine datasets to explore bigger questions or later groups of students could also expand these datasets.
After creating datasets, students then learned to use Carto, a digital mapping tool (previously CartoDB). Walking through the process of creating a map using Carto step by step in the classroom allowed students to practice using the tool and to ask questions or get extra help while learning. A written tutorial can also provide students with a resource if they fall a step behind or need reminders later of the steps they took to use this tool.
After creating datasets and learning how to use Carto, students applied this knowledge in an independent map-making exercise. For this assignment, students paired two datasets to create a map. In addition to using the dataset they had created as part of the Gathering Data exercise, they also used a classmate’s dataset shared on a cloud drive. Some students, knowing that they would complete this assignment later, had already worked together to create datasets that paired. Other students joined seemingly unrelated data looking for a correlation (candy shops and schools, for example). The goal of this assignment was not only to have students create a map using Carto, but also to allow them to make a conjecture, view the result of that conjecture spatially, and to articulate what it could tell us about spatial history. Students posted their maps to their class blogs, along with a reflection on what the map showed, what went well or badly, and what they would do to expand or improve this map. This reflection also allowed students to connect their map to class topics on San Francisco and spatial history more broadly.
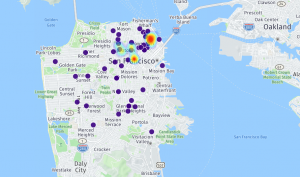
A map created by Wieck’s student, Connor Doyle, showing bank locations in San Francisco in 1907 and 1931
One student created a pair of maps that compared bank locations in San Francisco in 1907 and 1931 (before and after the Stock Market Crash) with fascinating results. In 1907, banks were concentrated downtown, but in 1931, they began to spread through the city’s neighborhoods (map 1, credit Connor Doyle). In a second map, Doyle identified that all of these neighborhood banks were Bank of America branches. Upon further research, we learned that Bank of America expanded its branch banking throughout the early 1900s in California, creating a model that sustained this chain while other local banks suffered during the Depression. In another example, a student created a map (map 2, credit Erica Loberg) showing the location of gay bars in San Francisco throughout the 20th century as a way of examining patterns of LGBT sociality and presence across this period. Creating maps like these allowed students to do historical research and explore themes of continuity using spatial history and digital tools, while identifying historically interesting findings and sharing them publicly.
The educational benefits of doing this kind of work are many. For example, creating and analyzing maps provides students a different type of opportunity to do historical research and produce original scholarship. While students might have paired two datasets that did not identify anything exciting or distinct, they still learned by articulating what went wrong and what they could have done differently to produce more exciting or useful results. By using digital tools such as maps, students can also interface with the public by sharing their maps and analysis online via blogs or other mechanisms of digital communication. Other opportunities for students to share their work include presentations on campuses or in local communities. For example, two of my students shared their maps and class research in five-minute lightening round segments at a GIS Day on campus during the course.
Through mapping activities like these, students also learn transferable skills that they can employ in fields outside of the humanities that can help them throughout their education and on the job market. For example, one of my students noted his plans to work with his high school admissions office to create a map of universities that students had been admitted to. Finally, and perhaps, most importantly, by learning about maps and creating them, students can become more critical consumers of maps and other content in news and social media.
Sample Assignment: Creating a Dataset
Sample Assignment: Creating Maps Using Carto
Other Useful Resources:
While there are many useful mapping tools available, I chose Carto because of its accessibility. ArcGIS is another tool available for making data maps. The online version has limited free online access.
Useful resources in helping students understand spatial history, GIS methods, and the practical construction of maps and visual representation of data:
- Narrative map resources:
- A StoryMapJS tutorial I created
- Lincoln Mullen’s Narrative Map Exercise
- a student example of a StoryMapJS assignment
- John Krygier and Denis Wood, “Ce n’est pas le monde” (This is not the world), 2009.
- Isabel Meirelles, Design for Information, 2013.
- Katy Borner and David E. Polley, A Practical Guide for Making Sense of Data (2014)
- Sheila Lakshmi Steinberg and Steven J. Steinberg, GIS Research Methods: Incorporating Spatial Perspectives (2015)
- Richard White, “What is Spatial History?” Spatial History Lab, 2010.
This post first appeared on AHA Today.
Lindsey Passenger Wieck is assistant professor of history and director of public history at St. Mary’s University in San Antonio. Her research and teaching specialties bring together histories of cities, gentrification, and digital methodologies. Her research and teaching make use of spatial history, mapping, and text analysis to study culture, conflict, and cooperation in urban spaces.
Tags: AHA Today Teaching with Digital History
Comment
Please read our commenting and letters policy before submitting.


